
ORM Battle .Net has published a updated test results using ORM Tools in .Net.

DataObjects.Net show best test results.
DataObjects.Net show best test results.
 Collaboration is central to learning on the social Web. This guest post from Karen Schweitzer highlights some great free tools for connecting and sharing with others.
Being in the same room to collaborate on a project is no longer necessary thanks to the many different applications that are available over the web. There are free tools for online conferencing, collaborative writing and editing, file sharing, private communication, and desktop sharing. Here are 15 free online collaboration tools and apps to try today:
Keep and Share – Keep and Share is a group file sharing system. Accounts are password-controlled and secure enough to store sensitive information.
Wridea – Wridea makes it easy to collaborate and share ideas with colleagues, team members, and fellow learners. This brainstorming tool organizes and categorizes ideas onto different pages, provides unlimited storage, and allows users to comment on topics and ideas.
Writeboard – Whiteboard is free collaborative writing software. It can be used to write, edit, track changes, and rollback to previous versions.
Twiddla – Twiddla works very well for online meetings or co-browsing. Groups can use it to mark-up and comment on web pages, images, and other content.
Spicebird – This open source platform is an all-in-one suite of communication tools for people who want to collaborate online. Features include email, instant messaging, and an online calendar.
Stixy – Stixy works like an online bulletin board or whiteboard. It offers a work space where you can place content and collaborate with other people on the web.
ReviewBasics – This free online service is great for people who are collaborating and editing different types of content. ReviewBasics allows users to share, annotate, and markup everything from images and videos to documents.
EditGrid – EditGrid is a web-based application that works a lot like Microsoft Excel. Special features include sharing, collaborating, and publishing capabilities.
ooVoo – ooVoo offers a free 2-way video chat service and a 6-way text chat. The site can also be used to record and send short video messages.
Palbee – Palbee is a free video conferencing tool with multiple capabilities. Users can conduct video meetings with other people or record a video presentation for later viewing.
GroupTweet – GroupTweet is designed for Twitter users who want to be able to communicate and collaborate privately.
Edmodo – Edmodo is rather like a private Twitter. Students and teachers can use this free (and private) microblogging platform to communicate online. Edmodo also provides file sharing and file storage.
SimplyBox – SimplyBox allows users to capture specific images, text, and video and then organize their finding into an easy-to-share box. Conversations and comments can then be placed around the box and shared once more.
Mikogo – This free desktop sharing software can be used for online meetings, web conferences, presentations, remote support, and other collaborative efforts. Mikogo is incredibly simple to use and download.
Vyew – Vyew is a relatively new collaboration platform that can be used for webinars, online conferences, and real-time learning and instruction. No installation is required and all activity can be tracked and logged.
(From www.missiontolearn.com)
One of the important factors for performance degradation in .NET code is memory consumption. Many developers just concentrate on execution time to determine performance bottle necks in a .NET application. Only measuring execution time does not clearly give idea of where the performance issue resides. Ok, said and done one of the biggest task is to understand which function, assembly or class has consumed how much memory. In this tutorial we will see how we can find which functions consume how much memory. This article discusses the best practices involved using CLR profiler for studying memory allocation.
Please feel free to download my free 500 question and answer ebook which covers .NET , ASP.NET , SQL Server , WCF , WPF , WWF@ http://www.questpond.com .
Let’s start this article by first thanking Peter Sollich who is the CLR Performance Architect to write such a detail help on CLR profiler. When you install CLR profiler do not forget to read the detail help document written by Peter Sollich.
Thanks a lot sir, if ever you visit my article let me know your inputs.
CLR profiler is a tool which helps to detect how memory allocation happens in .NET code. CLR profiler tool is provided by Microsoft, you can download the same from
http://www.microsoft.com/downloads/details.aspx?familyid=A362781C-3870-43BE-8926-862B40AA0CD0&displaylang=en .
Note :- There are two version of CLR profiler one for .NET 1.1 and the other 2.0 framework. For 2.0 CLR profiler you can visit http://www.microsoft.com/downloads/details.aspx?familyid=A362781C-3870-43BE-8926-862B40AA0CD0&displaylang=en and to download 1.1 you can use http://www.microsoft.com/downloads/details.aspx?familyid=86ce6052-d7f4-4aeb-9b7a-94635beebdda&displaylang=en#Overview
Once you download CLR profiler you can unzip and run ‘CLRProfiler.exe’ from the bin folder.
If you have downloaded 2.0 CLR profiler it provides executables for ‘X86’ and ‘X64’ environment. So please ensure to run the appropriate versions.
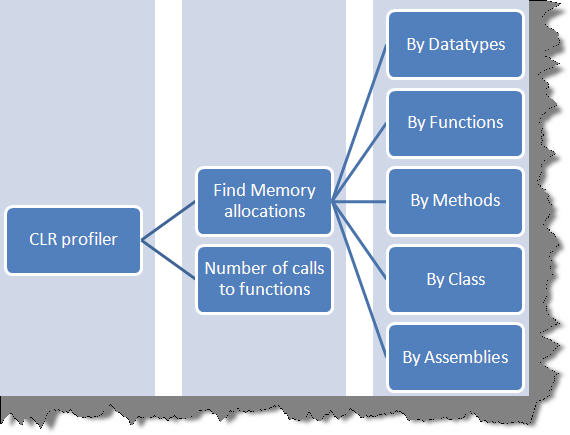
CLR profiler is the best tool when it comes to understanding how memory allocations are done in .NET application code. It does two prime importance functions:-
• Gives a complete report of how memory is allocated in a .NET application. So you can see full report how memory is allocated as per data types, functions, methods etc.
• It also provides how much time the method was called.
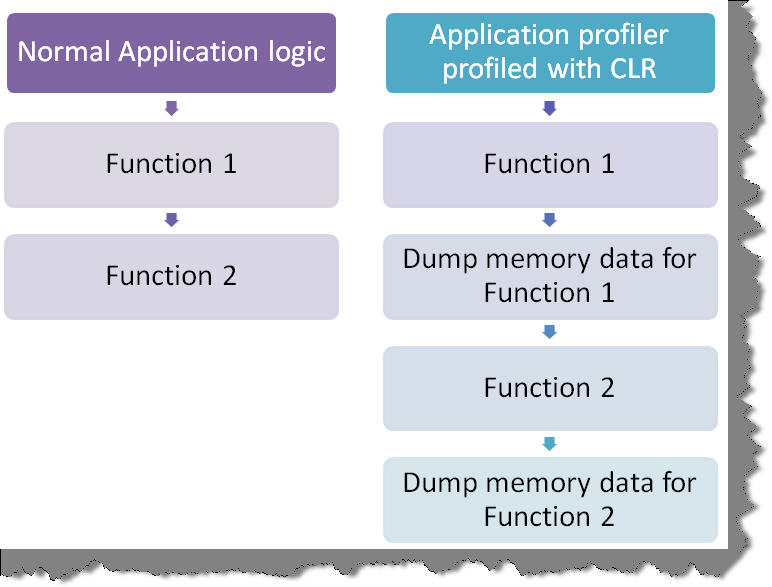
CLR is an intrusive tool. In other words it runs its own logic of dumping memory values for every function / class / modules inside the application. In other words it interferes with the application logic. Let’ say you have a normal application which calls function 1 and function 2. When you profile your application with CLR profiler it injects dumping of memory heap data after every function call as shown below.
In other words do not use CLR profiler to find execution time of your application. It actually slows down your application 10 to 100 times. You will end up with wrong results.
As said because it’s an intrusion tool you should never use the same in production environment.
First thing you should never first start analyzing your performance issues by CLR profiler tool. It’s more of a second step activity where you have zeroed on a function or a class which is having memory issues. So probably you can use performance counters to first find which methods and functions take long execution time and then use CLR profiler to see how the memory allocations are done.
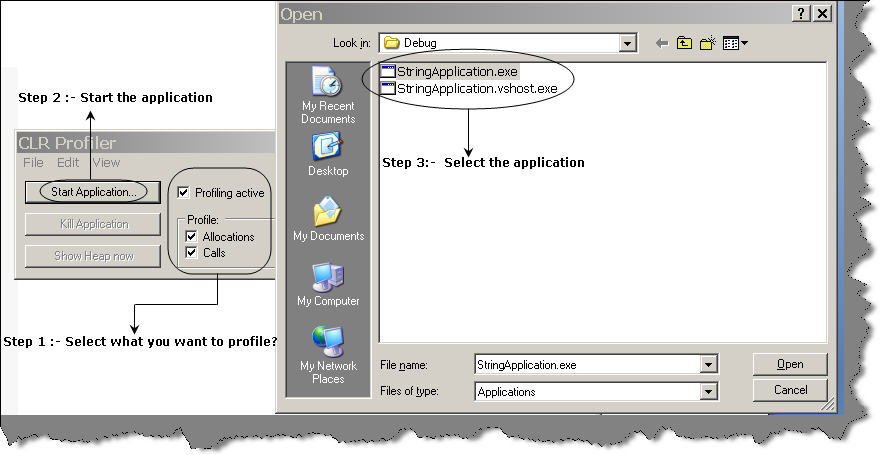
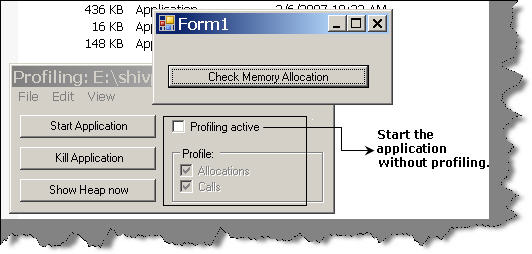
One you have downloaded the CLR profiler from Microsoft site, unzip the files in a folder. Go to the unzipped folder in Binaries choose your processor and run ‘CLRProfiler.exe’. You will be shown the CLR profiler as shown in the below figure.
The first step we need to decide what do we want to profile. There are two things one is the memory allocation and the other is number of calls to a method. So select what data you want to profile and then click start application.
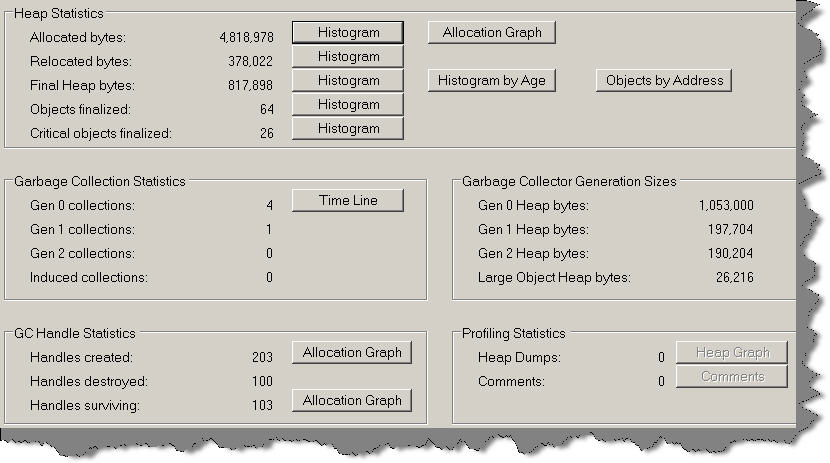
Once you are done you can see the complete summary of profiling as shown below. It’s a very complicated report we will see a simplistic approach when we profile the sample application.
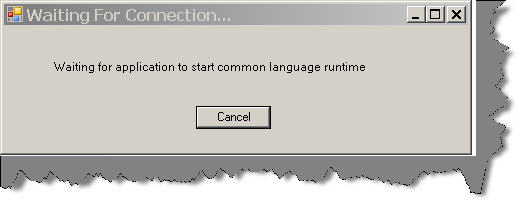
Some issues we faced while running CLR profiler. If you are getting the below screen and it does not stop, there can be two reasons:-
• You have .NET 2.0 and you are running CLR profiler 1.1.
• You have not registered ProfilerOBJ.dll in GAC.
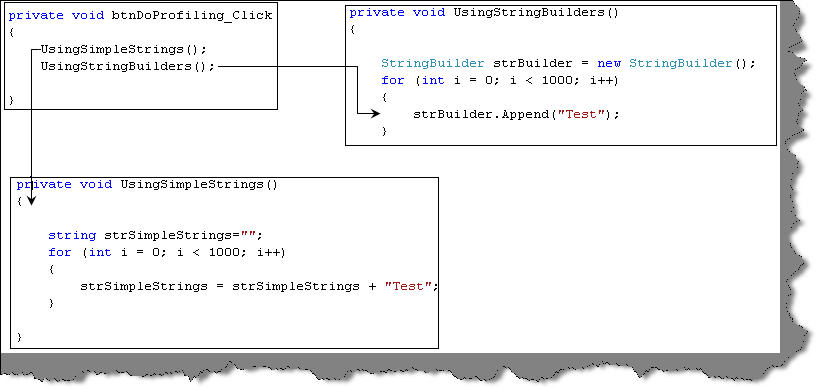
The application which we will profile is pretty simple. It has a simple button which calls two functions ‘UseSimpleStrings’ and ‘UseStringBuilders’. Both these functions concatenate strings. One uses ‘+’ for concatenations while the other uses the ‘StringBuilder’ class. We will be 1000 times concatenating the strings.
private void UsingSimpleStrings()
{
string strSimpleStrings="";
for (int i = 0; i < 1000; i++)
{
strSimpleStrings = strSimpleStrings + "Test";
}}
The function which uses ‘StringBuilder’ class to do concatenation.
private void UsingStringBuilders()
{

StringBuilder strBuilder = new StringBuilder();
for (int i = 0; i < 1000; i++)
{
strBuilder.Append("Test");
}
}
Both these functions are called through a button click.
private void btnDoProfiling_Click(object sender, EventArgs e)
{
UsingSimpleStrings();
UsingStringBuilders();

}
Now that we know our application we will try to use profiler to see which function uses how much memory. So click on start application browse to the application exe and click on check memory allocation button and close the application. You will be popped up with a complete summary dialog box.
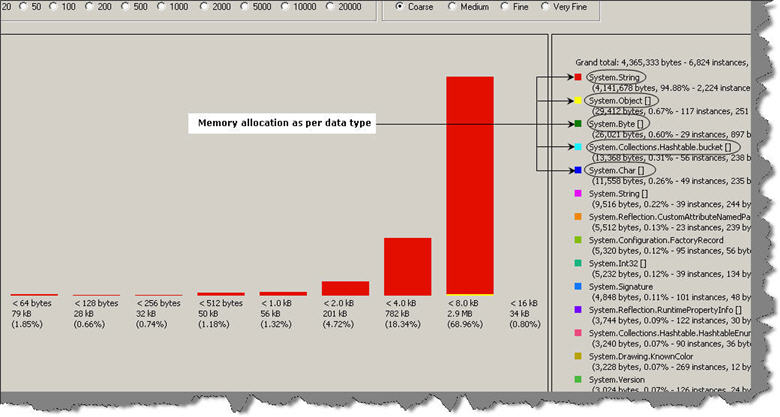
If you click on histogram button you can see memory allocations as per data type. I understand it’s very confusing. So leave this currently.
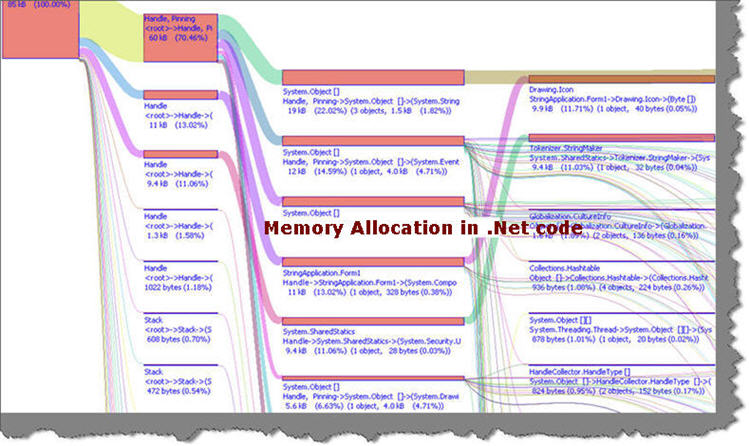
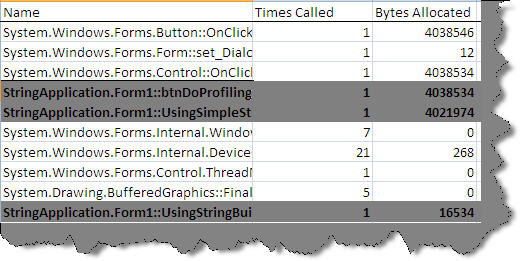
If you are interested to see how much memory is allocated as per functions you can click on ‘Allocation Graph’. This gives as per every function how much memory is consumed. Even this report is very confusing because so many function, so many methods and we are not able to locate our two functions of string ‘UsingStringBuilders’ and ‘UsingSimpleStrings’.
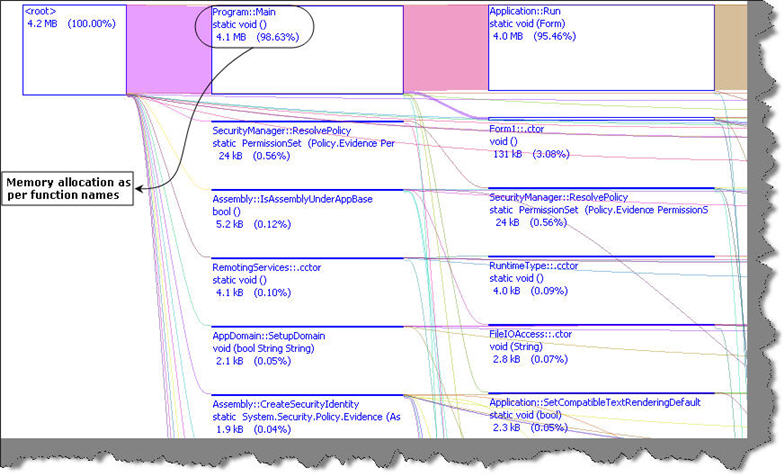
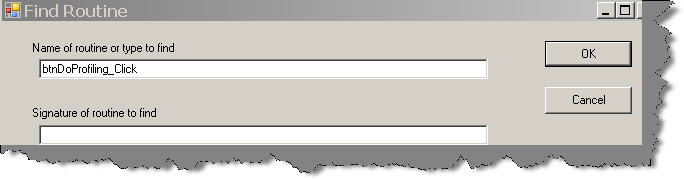
To simplify the above graph right click and you will be popped with lot of filtering options. Let’s use the ‘Find Routine’ search to filter unnecessary data. We have entered to get the button click event. From this button click those two functions are called.
The search now zooms on the method as shown in the below figure. Now double click on the ‘btnDoProfiling_Click’ box as highlighted in the below figure.
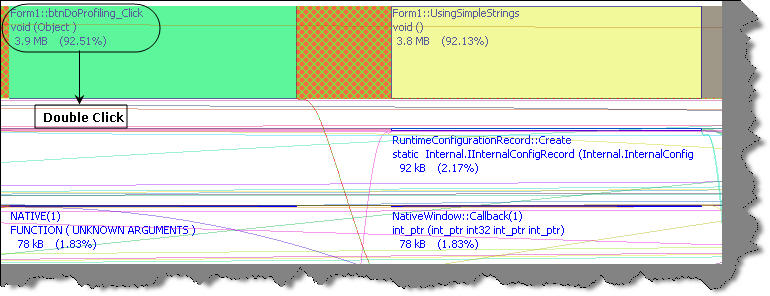
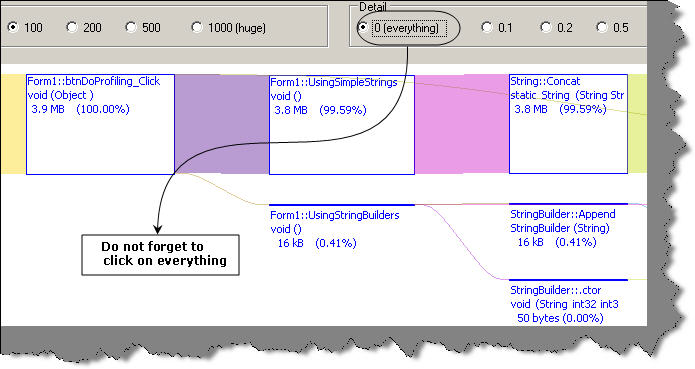
After double click you will see the below details. It’s now better. But where did the second function go off. It’s only showing ‘UseSimpleStrings’ function. This is because the report is coarse. So click on everything and you should see all the functions.
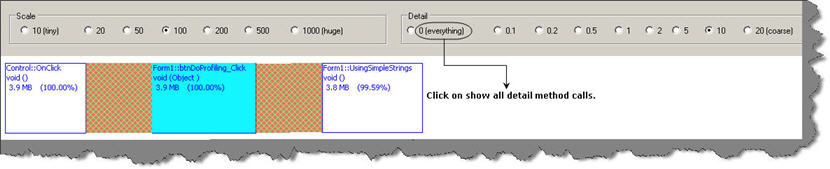
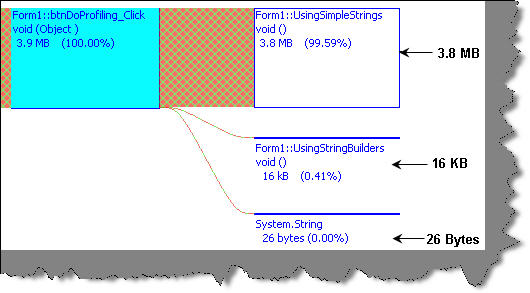
You can now see the other function also. What’s the 26 bytes ?. It’s just an extra string manipulation needed to when the functions are called, so we can excuse it. Let’s concentrate on our two functions ‘UseSimpleStrings’ and ‘UseStringBuilders’ can now be seen. You can see string concatenation takes 3.8 MB while string builder object consumes only 16 KB. So string builder object is consuming less memory than simple string concatenation.
The above shown way was really tough. Let’s say you have 1000 of functions and you want to analyze which function consumes what memory. It’s practically just not possible to go through every call graph, do a find and get your functions.
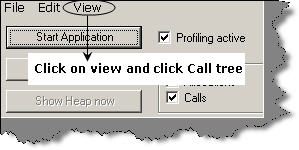
The best way is to export a detail report in to excel and then analyze the data. So click on view call tree.
Once you click on call tree you will be shown something as shown below. Click on view All functions you will be shown all functions click on file and save it as CSV.
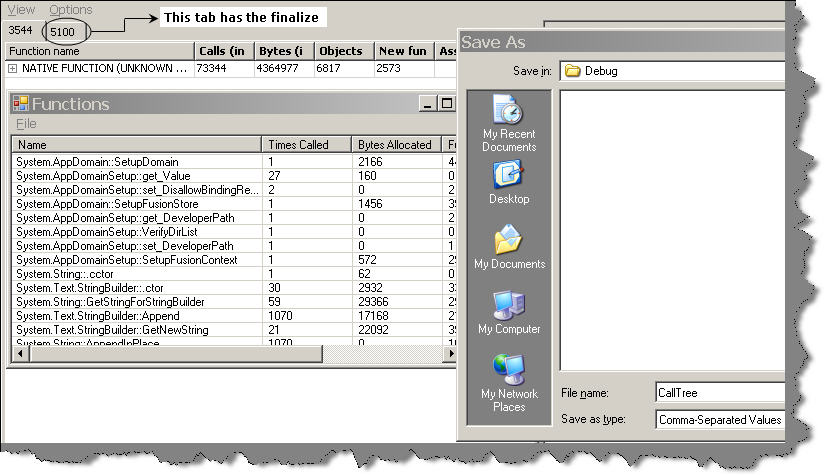
Once you have exported the complete data to CSV, you can easily locate your methods and functions and see how much data has been allocated.
In case you know which methods to profile and you can enable the profiler at that moment when the method is called. In other words we can enable the CLR profiler from the application.
In order to enable the profiler from the C# code we need to first reference ‘CLRProfilerControl.dll’. You can get this DLL from the same folder where we have the profiler exe.
You can then directly call the profiler control from your code as shown in the below code snippet. We have enabled the profiler before we call both the string manipulation functions. Once the function calls are done we have disabled the profiler.
private void btnDoProfiling_Click(object sender, EventArgs e)
{
CLRProfilerControl.LogWriteLine("Entering loop");
CLRProfilerControl.AllocationLoggingActive = true;
CLRProfilerControl.CallLoggingActive = true;

UsingSimpleStrings();
UsingStringBuilders();

CLRProfilerControl.AllocationLoggingActive = false;
CLRProfilerControl.CallLoggingActive = false;
CLRProfilerControl.LogWriteLine("Exiting loop");
CLRProfilerControl.DumpHeap();
}
So now let’s run the CLR profiler and start our application. Please ensure that you disable the profile active check box because we are going to enable profiling from the code itself.
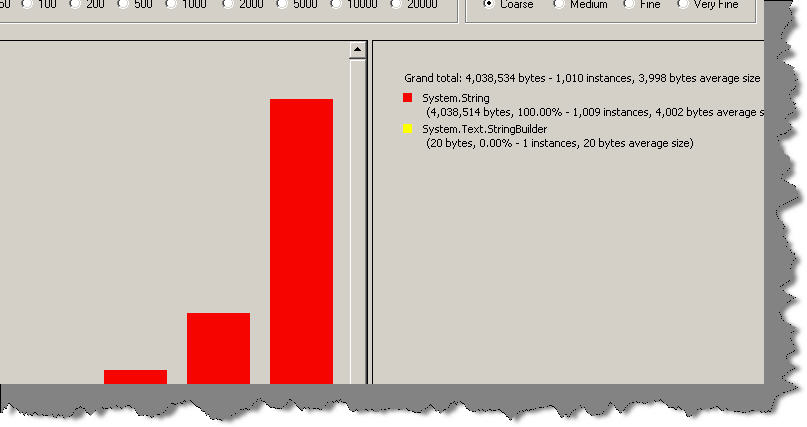
Now if you see the histogram you will see limited data. You can see it has only recorded memory allocation consumed from ‘System.String’ and ‘System.Text.StringBuilder’ data type.
If you see the allocation graph you can see it’s pretty neat now. The cluttered view has completely gone off and we have pretty simple and focused view. Please note to click ‘Everything’ to see the remaining functions.
On the summary page you can see the comments button. If you click on the comments button it shows start time and end time. Do not get carried away with the time recorded. As we have previously cleared that it’s an intrusive tool the results are not proper.
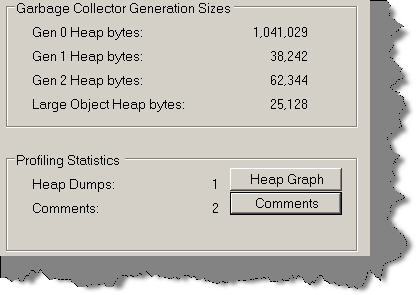
Entering loop (1.987 secs)
Exiting loop (2.022 secs)
• CLR profiler can be used to find memory allocated to functions, classes and assemblies to evaluate performance.
• It should not be used on production.
• It should not be used as a starting point for performance evaluation. We can first run perf counter, get the method having high execution time and then use CLR profiler to see the actual cause.
• You can use histogram to see memory allocation and call graph to see method wise memory allocation.
• If you know which methods you want to profile you can enable profiler from the application itself.
Concluding everything in to one basket as a best practice when you want to see memory allocation nothing can beat CLR profiler.
Đã qua thời nhân viên IT thoải mái nhảy việc khi “người ít việc nhiều”. Kinh tế toàn cầu suy thoái, và hàng nghìn lao động ngành IT bị sa thải trên toàn thế giới. Nhưng, vẫn không thiếu tin tức về việc thiếu hụt nhân lực chất lượng cao trong lĩnh vực này tại Việt Nam. Nhưng cơ hội chỉ dành cho những người thức thời.
Thực tế đang cần gì?
Trong một hội nghị về triển khai đào tạo nguồn nhân lực theo nhu cầu của các ngành Công nghệ thông tin, Tài chính – Ngân hàng, Du lịch được Bộ Giáo dục & Đào tạo tổ chức cách đây ít lâu, lãnh đão hai thành phố lớn nhất cả nước là Hà Nội và Tp. Hồ Chí Minh đều cho biết, hiện nay hai đơn vị này thiếu trầm trọng lao động chất lượng cao, đặc biệt là trong lĩnh vực CNTT. Ông Nguyễn Thành Tài - Phó Chủ tịch Thường trực UBND thành phố Hồ Chí Minh cho biết, hằng năm, quy mô đào tạo (trình độ đại học) ở thành phố Hồ Chí Minh là: Ngành Công nghệ thông tin: 5.660 người; Điện tử: 3.400 người;
Trong khi đó, ngành công nghệ thông tin - điện tử cần hơn 90.000 lao động vào năm 2010 (trong đó hơn 30.000 người có trình độ đại học và cao đẳng).
“Như vậy, thành phố cần cung ứng 30.000 chuyên viên công nghệ thông tin chất lượng cao một năm, trong khi khả năng đào tạo của các trường trên địa bàn khoảng 11.000 chuyên viên có trình độ cao đẳng trở lên” - ông Tài báo cáo.
Bà Ngô Thị Thanh Hằng - Phó Chủ tịch UBND thành phố Hà Nội cho biết: là các ngành dịch vụ chất lượng cao và các ngành công nghiệp công nghệ cao (công nghệ thông tin, viễn thông, tự động hóa, công nghệ sinh học…).
Trong lĩnh vực công nghệ thông tin, nguồn nhân lực không chỉ chưa đáp ứng được yêu cầu về số lượng, báo cáo của lãnh đạo UBND thành phố Hà Nội còn khẳng định, nguồn nhân lực chất lượng cao cũng rất hạn chế.
Cũng tại hội nghị này, các đơn vị tham gia cho biết: Nhân lực chất lượng cao phải có đủ kiến thức và kỹ năng chuyên môn nghề nghiệp; làm chủ được các thiết bị, công nghệ hiện đại; sử dụng được một ngoại ngữ trong chuyên môn, giao tiếp; có kỹ năng xã hội: giao tiếp, ứng xử, hợp tác, năng lực hoạt động sáng tạo; tác phong lao động công nghiệp, có lương tâm nghề nghiệp và sức khỏe tốt.
Sinh viên CNTT cần chuẩn bị?
Từ thực tế như vậy, các bạn sinh viên có thể biết trước để chuẩn bị cho mình đầy đủ kiến thức và các kĩ năng mềm để khi ra trường có thể làm việc được ngay, thay vì phải có thời gian đào tạo lại ở doanh nghiệp hay nhận một mức lương không xứng đáng. Hãy trang bị ngay từ bây giờ các yếu tố giúp bạn trở nên ấn tượng với nhà tuyển dụng. - Các chứng nhận chuyên môn trong lĩnh vực CNTT: hiện nay, các thương hiệu bá chủ trong lĩnh vực CNTT đều tổ chức được các chương trình đào tạo và cấp chứng chỉ chính hãng, vì thế, ngoài tấm bằng kĩ sư CNTT, sinh viên nên xác định và trang bị cho mình những chứng chỉ có trong hệ thống của các thương hiệu thống lĩnh thị trường CNTT. Ví dụ, các bạn có thể xác định ngay từ bây giờ việc mình muốn trở thành một kĩ sư lĩnh vực mạng hệ thống (Networking) thì các bạn sẽ cần đến hệ thống chứng chỉ của Microsoft như là MCSA, MCSE. Và việc tìm học để lấy chứng chỉ này sẽ giúp các bạn tiếp cận với chương trình đào tạo tiêu chuẩn quốc tế, thực hành trên thiết bị thực, giao lưu với các nhà tuyển dụng ngay trong quá trình theo học, thi chứng chỉ quốc tế chính hãng được công nhận trên toàn cầu….
- Chuẩn bị vốn tiếng Anh tốt nhất: Nếu bạn đã tìm học và đạt được các chứng nhận chuyên môn nói trên, thì khả năng tiếng Anh của bạn trong lĩnh vực CNTT cũng đã tốt hơn rất nhiều. Vì khi tham gia học tập chương trình CNTT của các hãng (ví dụ là Microsoft) các bạn đều được học giáo trình gốc được các hãng này biên soạn bằng tiếng Anh dùng thống nhất trên toàn cầu, thực hành trên hệ thống sử dụng tiếng Anh, tham gia kì thi lấy chứng chỉ quốc tế hoàn toàn bằng tiếng Anh. Vì thế, trong quá trình học tập các bạn sẽ đạt được 2 mục đích, lấy được chứng chỉ chuyên môn danh giá và nâng cao khả năng sử dụng tiếng Anh trong thực tế.
- Kĩ năng mềm: Nếu như các bạn tìm kiếm được những Đối tác được ủy quyền đào tạo chính thức của các hãng danh tiếng nói trên tại Việt Nam (với Microsoft các đối tác này được gọi là Microsoft Certified Partner for Learning Solutions – CPLS) thì việc hoàn thành các chứng chỉ của họ cũng đồng nghĩa với việc bạn đã được trang bị những kĩ năng mềm quan trọng trong quá trình làm việc: kĩ năng giao tiếp, kĩ năng làm việc nhóm, kĩ năng thuyết trình,… Vì trong quá trình học tập, các đơn vị được ủy quyền đào tạo các chứng chỉ chuyên môn cũng cần đảm bảo các bài học – bài thi được triển khai theo đúng cách để phát huy được các kĩ năng nói trên.
The PHP scripting language has become one of the most popular server side languages around. Add to that, the power and integration of the open source MySQL database system, and you have a very powerful set of tools in your hand. That said, we will start off with some wonderful PHP and MySQL cheat sheets.
1. Added Bytes - PHP Cheat Sheet v2
The AddedBytes cheat sheet above covers multiple php topics such as functions list and regular expressions.
2. Blue Shoes - PHP Online Cheat Sheet
If you would rather not download a php cheat sheet, BlueShoes has provided an online php cheat sheet available for you to access at anytime.
3. WebCheatSheet - Regular Expressions Online Cheat Sheet
Regular expressions can get a little tricky no matter what language you are dealing with, WebCheatSheet has provided us with a quick online guide to php regular expressions.
4. AddedBytes - Regex Cheat Sheet (PDF)
Another excellent cheat sheet from AddedBytes, this regular expression cheat sheet is available as a pdf and packed full of helpful information.
Above you will find a helpful and quick online guide to basic and slightly complex MySQL commands.
If you're looking for a full fledged MySQL cheat sheet, look no further. The cheat sheet above (again, by AddedBytes) contains MySQL native functions, php MySQL functions, MySQL data types, and MySQL sample queries.
7. WikiBook - MySQL Cheat Sheet
The WikiBook MySQL Cheat Sheet is an open and member contributed online MySQL guide. It has the advantage of constantly being updated as the database languages evolves.
No front end developer would be complete without some basic Javascript skills. Wether you are working with raw Javascript or using one of the many popular AJAX libraries that are available, there are plenty of cheat sheets to go around.
This quick reference card summarizes the core features of JavaScript - naming conventions, variable types, control structures, intrinsic functions etc.
The above cheat sheet covers all kinds of Javascript topics such as function reference, regular expressions, XMLhttpRequests, event handlers, and a whole lot more.
10. Javascript and Browser Objects Quick Reference
This is actually Appendix A from the book The JavaScript Bible. Wiley (the publishers) have allowed the author to release certain parts of the Appendix, one part which contains Javascript and browser objects quick reference.
11. Gigantic List of Javascript Cheat Sheets
Perhaps you haven't seen the exact Javascript cheat sheet you have been looking for yet. The website above holds a vast array of very specific Javascript cheat sheets, certainly worth a quick browse.
Provided by the jQuery website, the jQuery visual map is a single (large) png image that allows you to visualize the jQuery API. It is perfect for a quick reference whilst working on a project.
The jQuery API browser is a way to access documentation on any function or feature of the jQuery language. Even better is the fact that you can download it as a stand alone Adobe Air application for you to use whenever you wish.
For those of you who prefer to download your cheat sheets in good ol' fashion pdf form, ACodingFool has come to our rescue. This cheat sheet covers the latest version of jQuery at the time of writing.
Time to give some love back to the Moo. This cheat sheet covers mootools v1.2+ and is really helpful for anyone starting to learn MooTools, or an old pro who just needs a refresher.
Go squared has put together an excellent and thorough HTML cheat sheet free for anyone to download. Especially great for beginners and those times when you just can't remember a certain tag.
17. HTML Cheat Sheet - PDF/PNG
As if AddedBytes haven't made enough cheat sheets for us already, they have made another one for HTML. This time it is available in two versions, as a pdf or as a single png image.
SmashingMagazine has released a wonderful and free HTML5 cheat sheet for you to start studying. Though we may not be at the point where we can use HTML5 everyday, it is always good to keep up with new technology.
Available in PNG or PDF format, this is an extremely thorough CSS cheat sheet you can refer to time and time again.
Seen above is a quick and dirty online CSS cheat sheet made by Leslie Franke. Great for quick access in the middle of a project.
Again, from SmashingMagazine comes another great freebie. This time it is a cheat sheet for CSS 3, which is gaining more and more browser support everyday.
22. Photoshop CS3 Keyboard Shortcuts Cheat Sheet
All keyboard shortcuts organized into four pages, by menu, as well as alphabetically by key.
This comes from the same makers as the CS3 cheat sheet, this time it has been modified for CS4. You can download it for free and browse it as a pdf.
24. Photoshop Brush Tool Cheat Sheet
The Photoshop brush tool is a very powerful one that has many unknown features. Learn to master that tool and you will probably be more efficient when designing. Keeping this cheat sheet handy will help you to learn all you need to know about the Photoshop brush tool.
25. Online Adobe CS4 Cheat Sheet
We're going to consider this an online cheat sheet, as it is just so darn helpful. You can choose from a wide list of Photoshop topics on the left to bring up more information about them. Think of it as an interactive cheat sheet.
26. Photoshop Tools Cheat Sheet
This is a great online cheat sheet that gives you access and information about all of the Photoshop tools and their shortcuts.
27. Illustrator Short Cuts Cheat Sheet
The beautiful WebDesigerWall has put together an online cheat sheet and post full of tips for using Adobe Illustrator shortcuts.
28. AI Shortcuts Cheat Sheet - PDF
This media pack comes with multiple pdfs packed with Adobe Illustrator shortcuts information and references. Also included in the pack are cheat sheets to other popular Adobe products.
For all of the WordPress lovers out there, WPCandy has put together an online WordPress 'help sheet' to get you any information you may have forgotten or not seen before.
Lastly, we have the all mighty SEO cheat sheet, kindly made for us by the guys over at the SEOMoz blog. Most websites could use some SEO once in a while, and this cheat sheet is a nice place to start.
(From www.webhostingsearch.com)

If you are in the Web Development area, you may be busy to catch up the current trend of technology. Modern Internet changes every second and new items are coming up every moment. If you were on holiday for few days, you may start to worry if you were getting behind the current technology news.
Or if you are a newbie, and doesn’t know where to start to develop your programming skills, then the Web Development Magazine online would be the best resources for you to improve your programming skills as well as catching up the current technology trend.
There are a lot of websites and forums providing the web resources and information online including FishintheRiver.com. To start with, I’m going to list 20 must-know websites for web development resources that are quite popular out there (so you may already know some of them). If you found any new, bookmark or subscribe the RSS, and keep yourself updated ![]()
Here I found an interesting video (from Youtube) created by Microsoft. Will the future be like this?
Microsoft’s Future Vision Series: Microsoft’s 2019 Future Vision Montage: Envisioning the Future HD
Hope you enjoy this article and if you know any other good websites for Web development, please leave your comment ![]() Get Inspired By FishintheRiver.com!
Get Inspired By FishintheRiver.com!
Smashing Magazine is a weblog dedicated to web-developers and designers.

A List Apart Magazine (ISSN: 1534-0295) explores the design, development, and meaning of web content, with a special focus on web standards and best practices.

Nettuts+ is a site aimed at web developers and designers offering tutorials and articles on technologies, skills and techniques to improve how you design and build websites.

A collection of free web resources.

Another collection of free web resources.

Webmonkey is an online resource for web developers. Here, you’ll find tutorials, tips and advice for designing and building websites and programming web applications.

Digital Web Magazine is an online magazine intended for professional web designers, web developers and information architects. The magazine consists primarily of work contributed by web authors, as well as by others who occasionally delve into the web realm.

Creative Web Development Magazine

You can read technology news.

Another Technology News here.

A Web Development Magazine

A handbook of CSS, Web Development, Color Tools, SEO, Usability

WebD&D offers free top-notch tips, tricks, best practices and resources for your reading pleasure.

Antonio Lupetti provides information about Web design, tutorials, resources and inspiration.

IBM’s resource for developers and IT professionals.

We can get a lot of web information from dev to marketing.

Wake Up Later is a website that touches on the subjects of website building, freelancing, blogging, and online entrepreneurship. It covers a variety of topics from freelance tips and programming to SEO and internet marketing.

It covers various topics like .NET, Andriod and Framework

Tutorialblog was started in 2005 to provide Photoshop Tutorials on various techniques and effects. Now it covers some tech areas like resources.


